

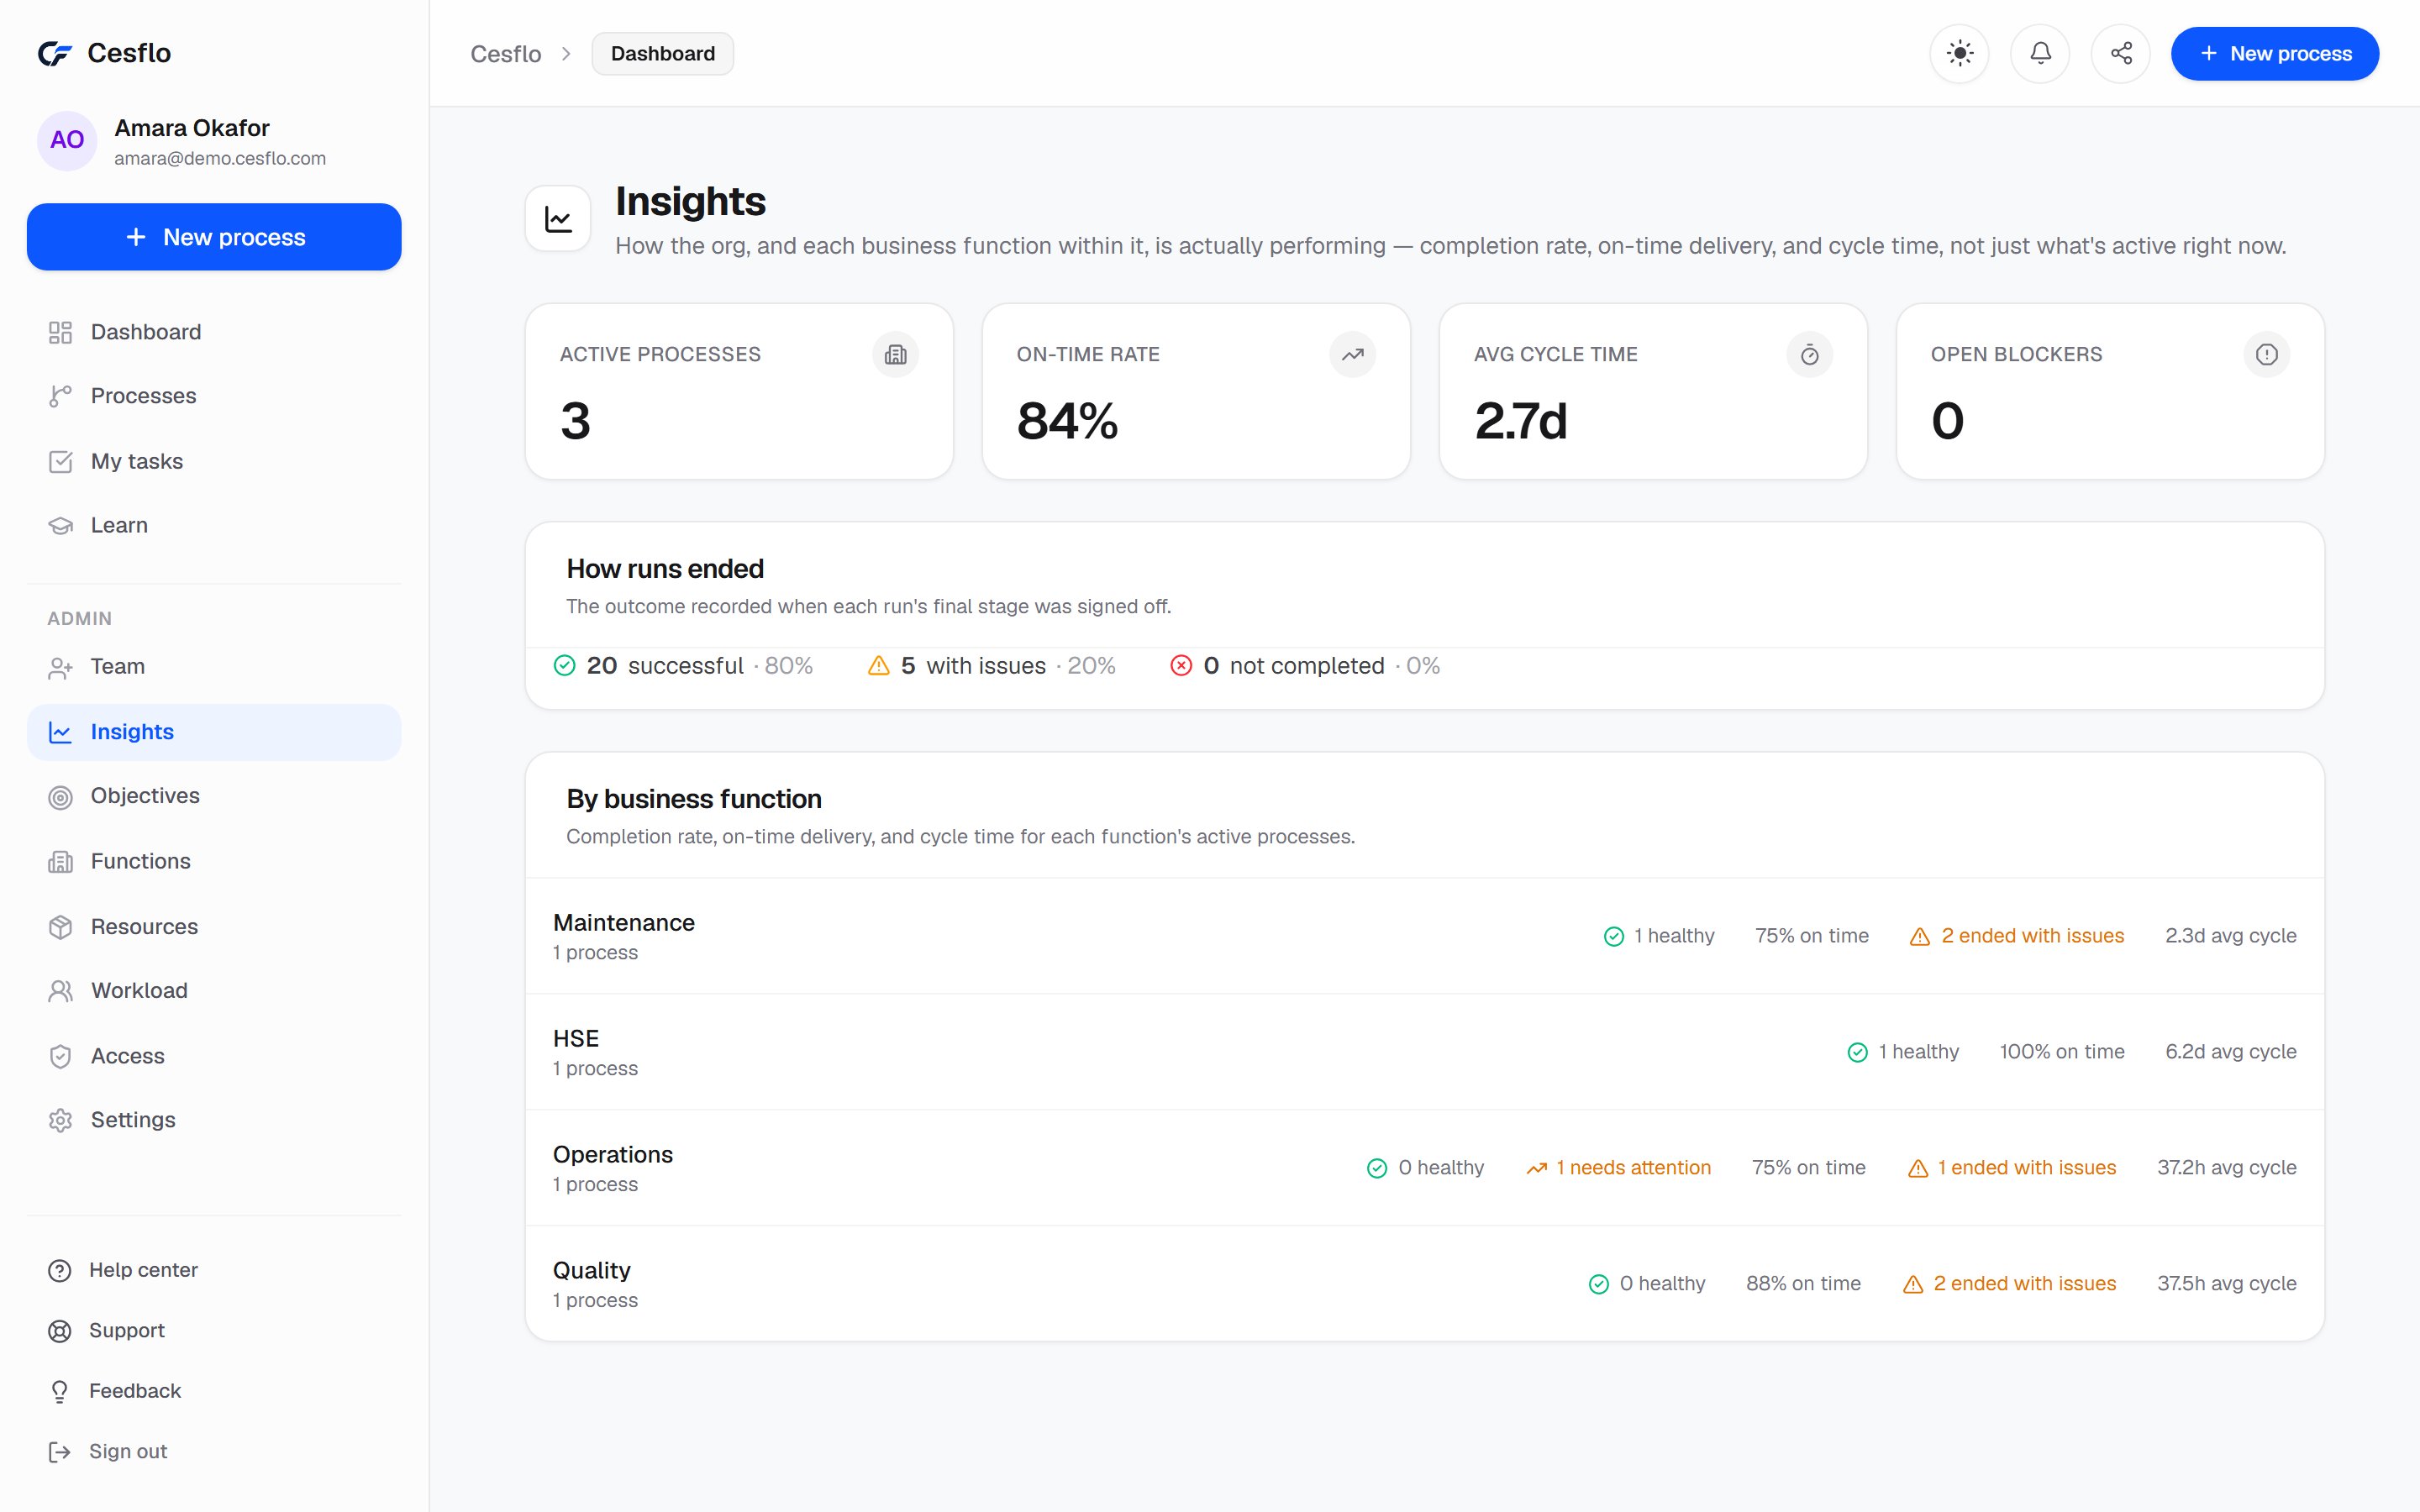
If you could only track two numbers for a recurring process, make them cycle time and on-time rate. Together they tell you how long the work takes and how reliably it hits its targets, and both point directly at where to improve.
Cycle time: from start to genuinely done
Cycle time is the elapsed time from when a run of the process starts to when its final step is signed off. Measure it per run, then look at the average and the spread. A process that averages three days but sometimes takes ten has a different problem from one that reliably takes five.
The useful view is cycle time per step. The overall number tells you there's a problem; the step-level number tells you where.
On-time rate: did it hit its targets?
Give every step a target duration. On-time rate is the share of completed runs that finished without any step being late or blocked. It's a stricter and more honest measure than 'did the whole thing finish by the deadline', because it shows where time was lost even when slack elsewhere covered it.
Collect the data as a by-product
Both metrics need accurate timestamps for when each step started and when it was signed off. If people have to log those separately, the data will be incomplete. When the process itself opens each step and records each sign-off, the timestamps are captured automatically and the metrics are always current.
Acting on the numbers
Find the step with the longest or most variable cycle time and ask why. Usually it's one of three things: the step waits on someone who isn't told it's their turn, it depends on another step that could run in parallel, or one person is carrying too much. Each has a different fix: notifications, restructuring the flow, or rebalancing workload.
Compare the same process across departments or sites too. The difference between the best and worst performer is often the clearest sign of what good looks like.